

Report Graphics Automation with Seaborn & Matplotlib
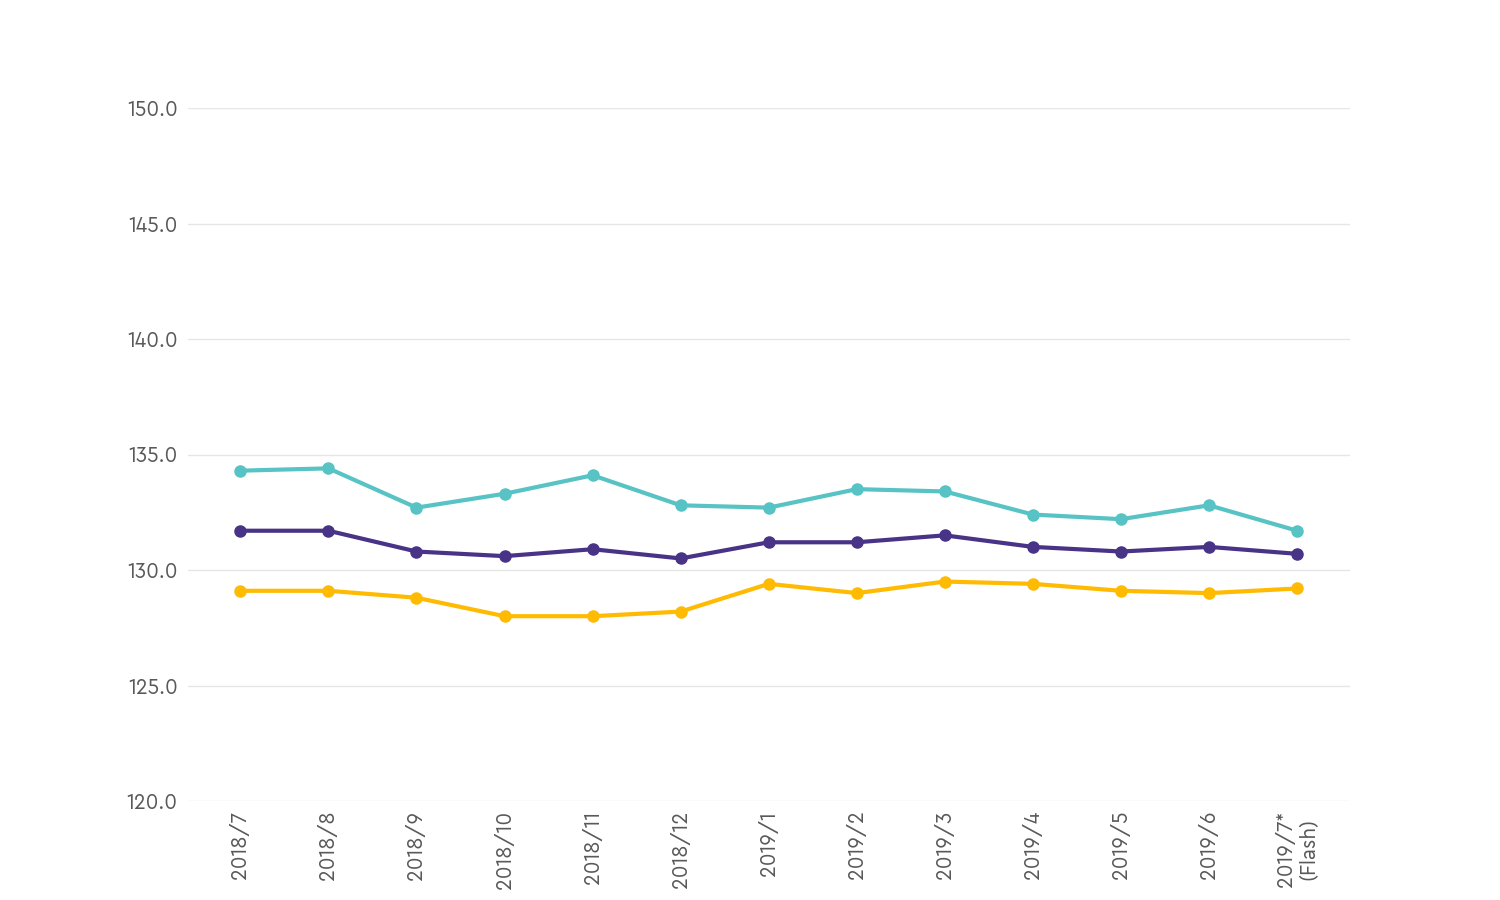
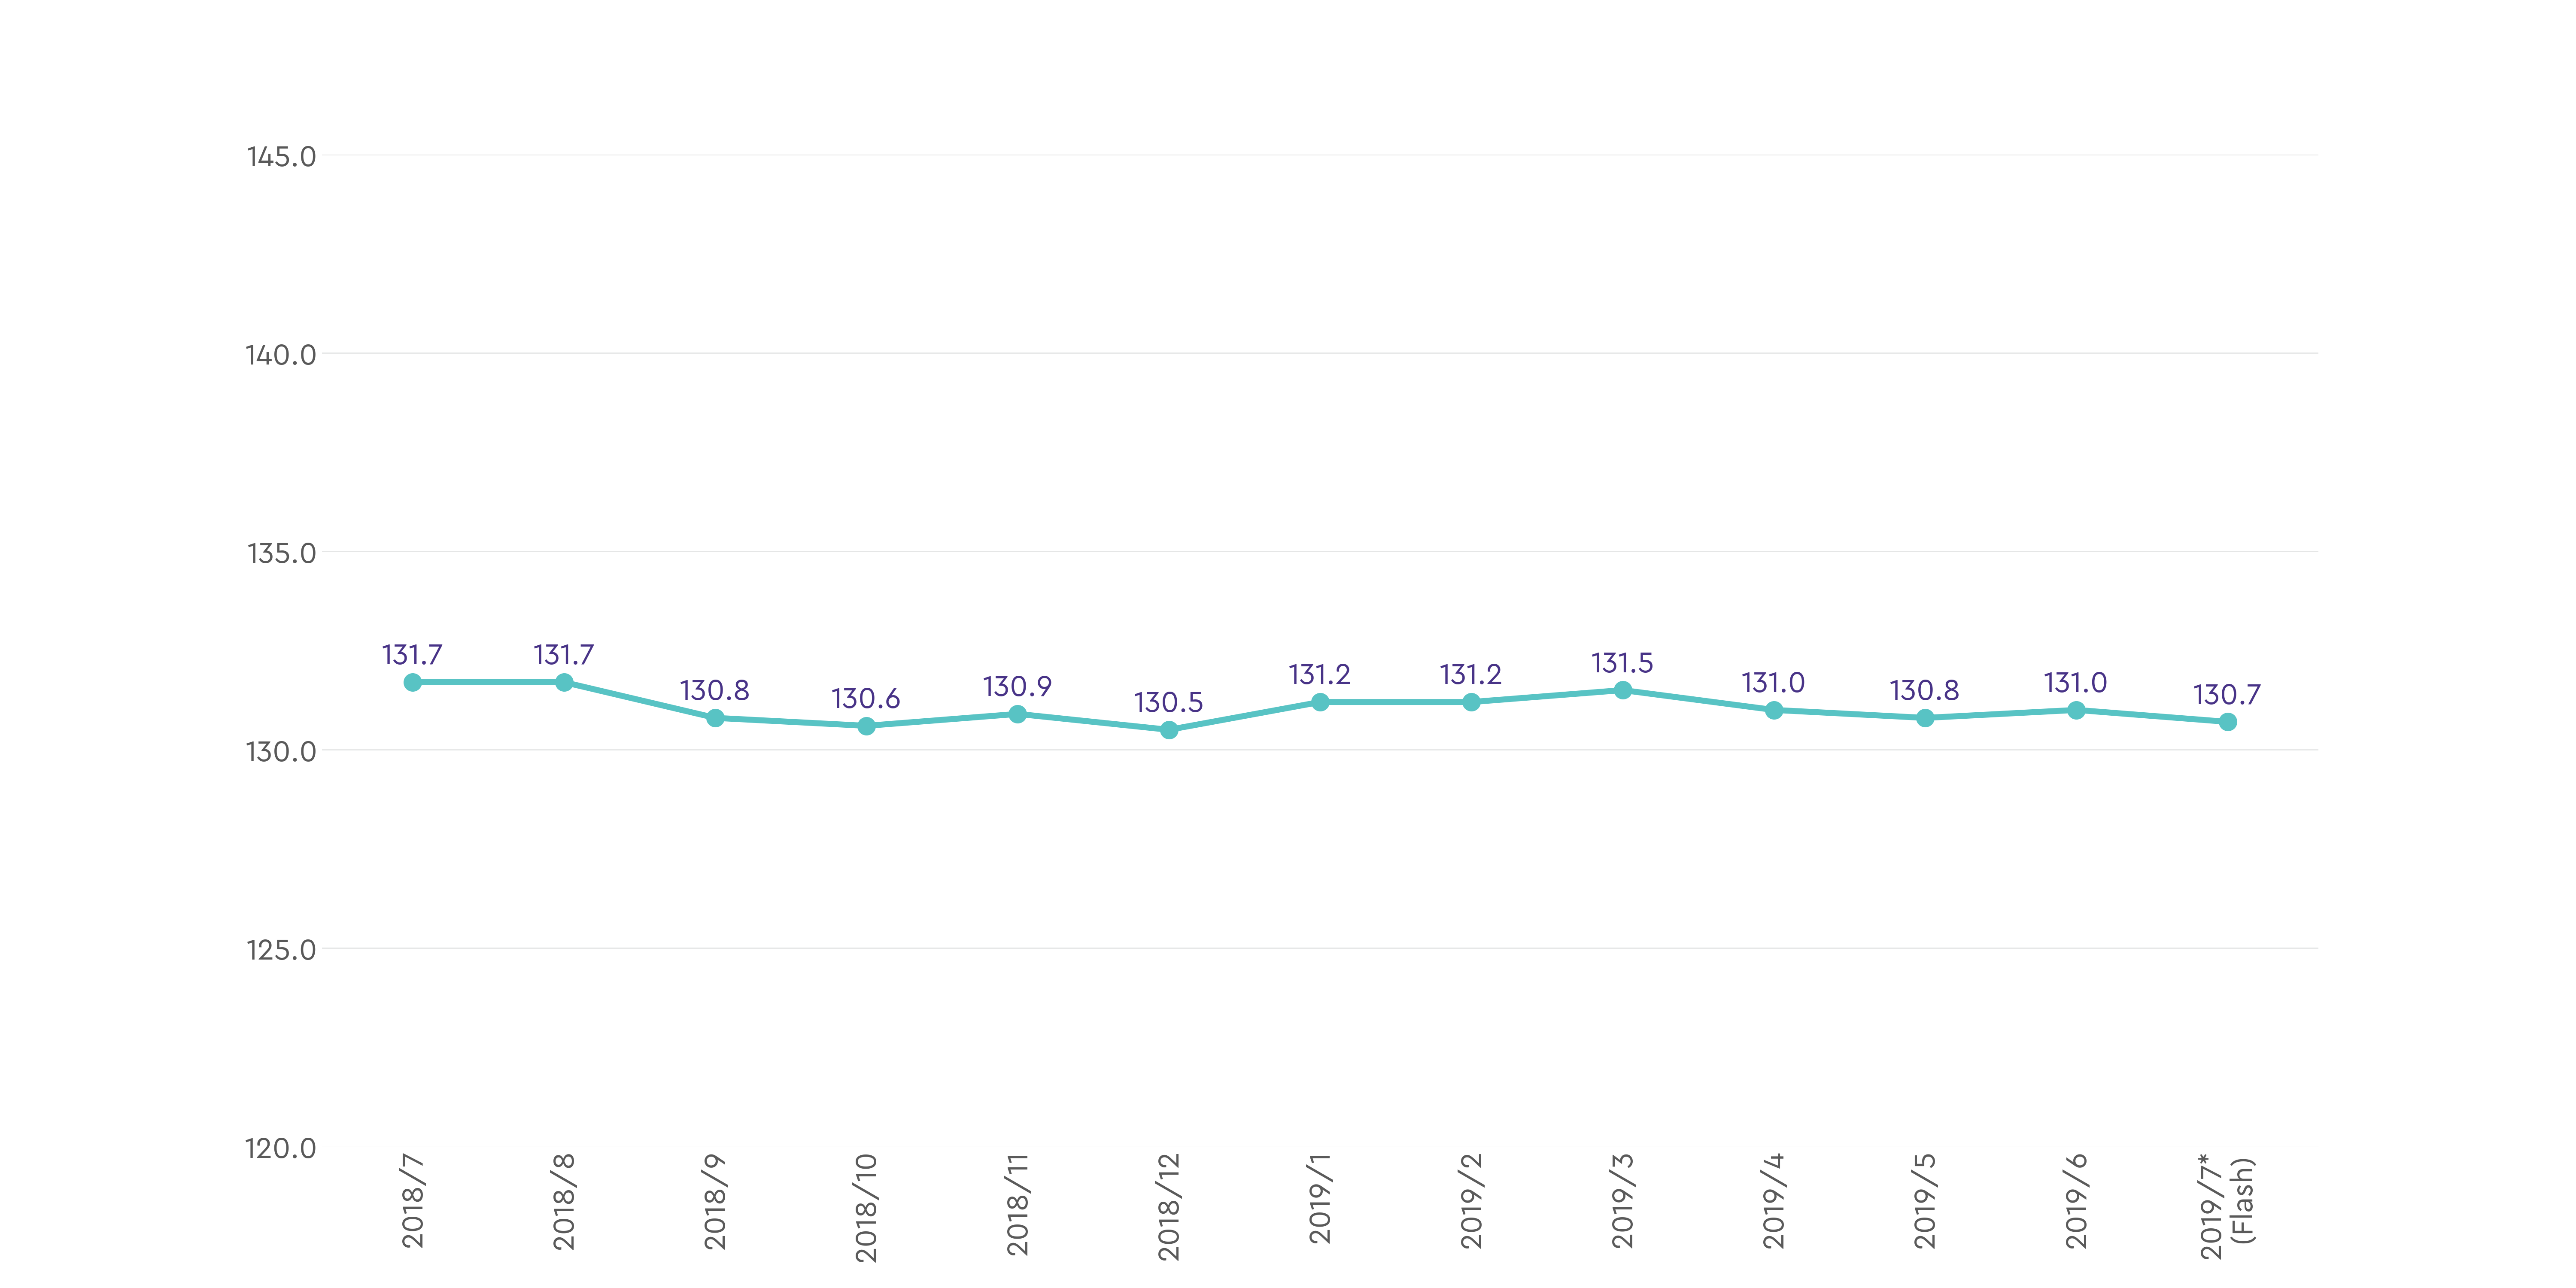
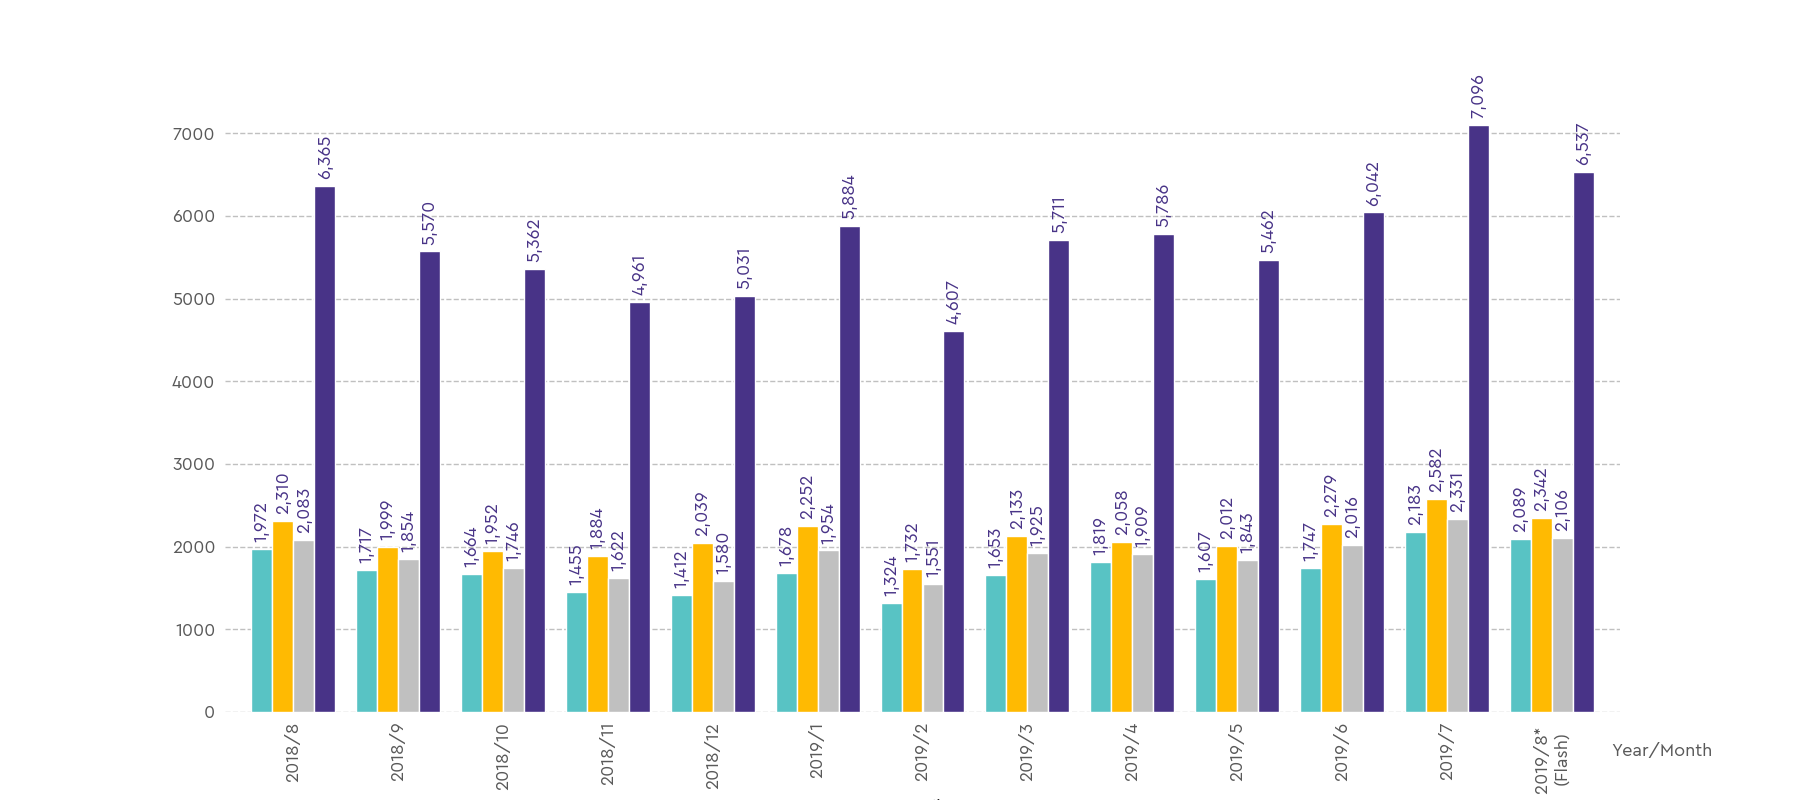
To reduce time spent on the manual task of replicating excel graphics from the database and an auto-generated data file, I employed the usage of matplotlib and seaborn libraries in Python to replicate the customized report graphics required in the reports.
Types of Graphics
Bar graphs, line charts, tables, stacked multi-colored bar charts, multi-bar bar charts and multi-line line charts.
Customizations Involved
∙ Graph labels
∙ Axes range
∙ Customized x-axis label
∙ Labels fonts
∙ Chart coloring
∙ Chart sizes (to fit in report)
∙ Line chart markers
∙ Chart values formatting (percentages, decimals & commas)
∙ Table cells shading by values retrieved from mysql database
Integration with master file CSV and MySQL database
The Python script to populate the master file values and draw the charts were wrapped up with python's argparse to specify the period of the report to be generated and configuration scripts to access the database.
Impact on the report generation process
The original report generation process involved combining and retrieving transactions from the database before running R scripts to obtain the report indexes. In addition, individual graphs and tables had to be individually manipulated before they are ready to be added to the report. This entire process accounts for roughly 3 hours of the data team's time whereas the new process saves 175% of the report generation time required as it takes at most 15 minutes on average to generate the graphs. To see how a sample report looks like, click here.
- Completed18 Aug 2019